
ICP burn is accelerating. ICP On-Chain Report, Week 1
Nearly 37,000 ICP appeared on Saturday with no explanation. Burn is still 19x below target.

2 to 8 August, 2026
Somebody minted nearly 37,000 ICP on Saturday. That is more than half of everything minted all week. That figure landed nowhere near the monthly node provider payout, and I have no idea who did it or why.
That was not the only thing that moved. Compute execution jumped 14% after falling by half since May. Yesterday saw a 5% price move backed by a 62% jump in volume. And cycle burn crossed back above its 4-week average, which sounds like progress until you see the number it has to reach.
This is the first edition of a weekly report I will publish every Sunday. Everything in it is measured from official on-chain data. Nothing is estimated, and where I do not know something I will say so.
Executive Summary
Cycle burn is 19x below the Mission 70 target. Up slightly on the week, down 13% over four weeks.
The gap has not narrowed. It has moved between 17x and 28x over 12 weeks, and was closer to target in early July than it is now.
Compute demand rose 14%, crossing above its 4-week average. It remains around half its May level.
Roughly 12,000 ICP was burned against 71,000 minted, leaving supply up about 59,000 for the week. Burn covered 17% of minting, up from 9% last week.
Measured inflation is 3.4% over the past year. This is not comparable to Mission 70’s headline figures, for reasons set out below.
Nearly 37,000 ICP was minted on Saturday, the largest single day of the week and outside the monthly payout window. Unexplained.
The XDR floor is binding, so node provider rewards are being minted at the floor rate rather than the market rate.
Trading volume is down 36% over four weeks, but the final day saw volume jump 62% on a 5% price move.
157 proposals were adopted, almost all of them routine operations.
The Gap: 19x, No Trend
The Mission 70 whitepaper sets a demand-side target of 0.77 XDR per second of cycle burn. XDR is the IMF’s basket currency, and 1 trillion cycles (TC) is defined as 1 XDR. This week the network averaged 0.0399 XDR/s. That is a gap of 19.3x.
Burn rose 3% week on week and crossed back above its 4-week average, the first time it has done that in three weeks. Taken alone that reads as improvement.
It isn’t, and the 12-week series shows why. The gap has moved between 17x and 28x over that period. It sat at 17x in early July, meaningfully closer to target than today. Over the past four weeks burn is down 13%.
One correction worth making explicitly, since I published a different figure in this article. The gap was at 20.6x using a 90-day median. On that same basis today it reads 19.5x. That looks like the gap closed, but almost all of the move comes from the 90-day window rolling past late May, when weekly burn hit its 12-week low. As those readings drop out of the window, the median goes up on its own, without anything actually improving.
The honest summary is that cycle burn is bouncing around inside the same range it has been in for months, and going nowhere.
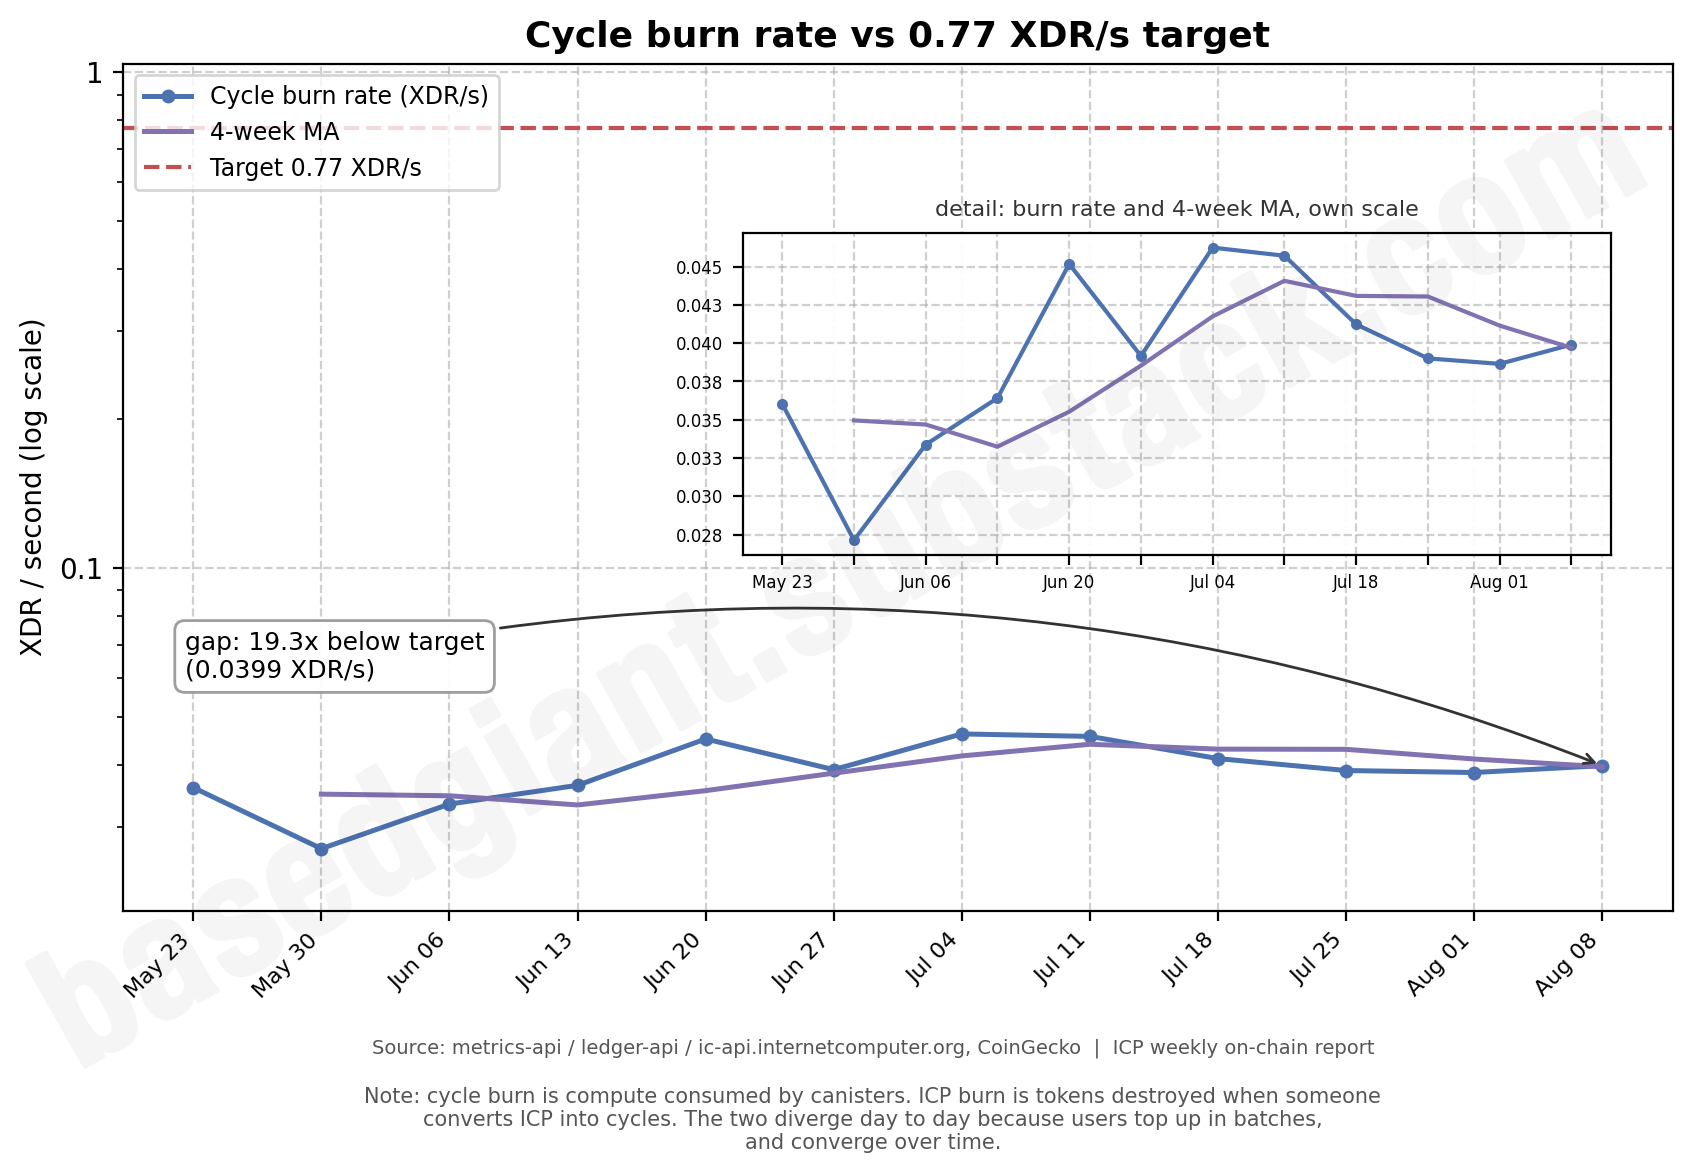
In money terms, the network consumed about 24,100 XDR of compute this week, which is roughly 15,000 ICP, or $33,000.
Note: Cycle burn is compute consumed by canisters. ICP burn is tokens destroyed when someone converts ICP into cycles. The two diverge day to day because users top up in batches, and converge over time.
Compute Reverses, But From a Long Way Down
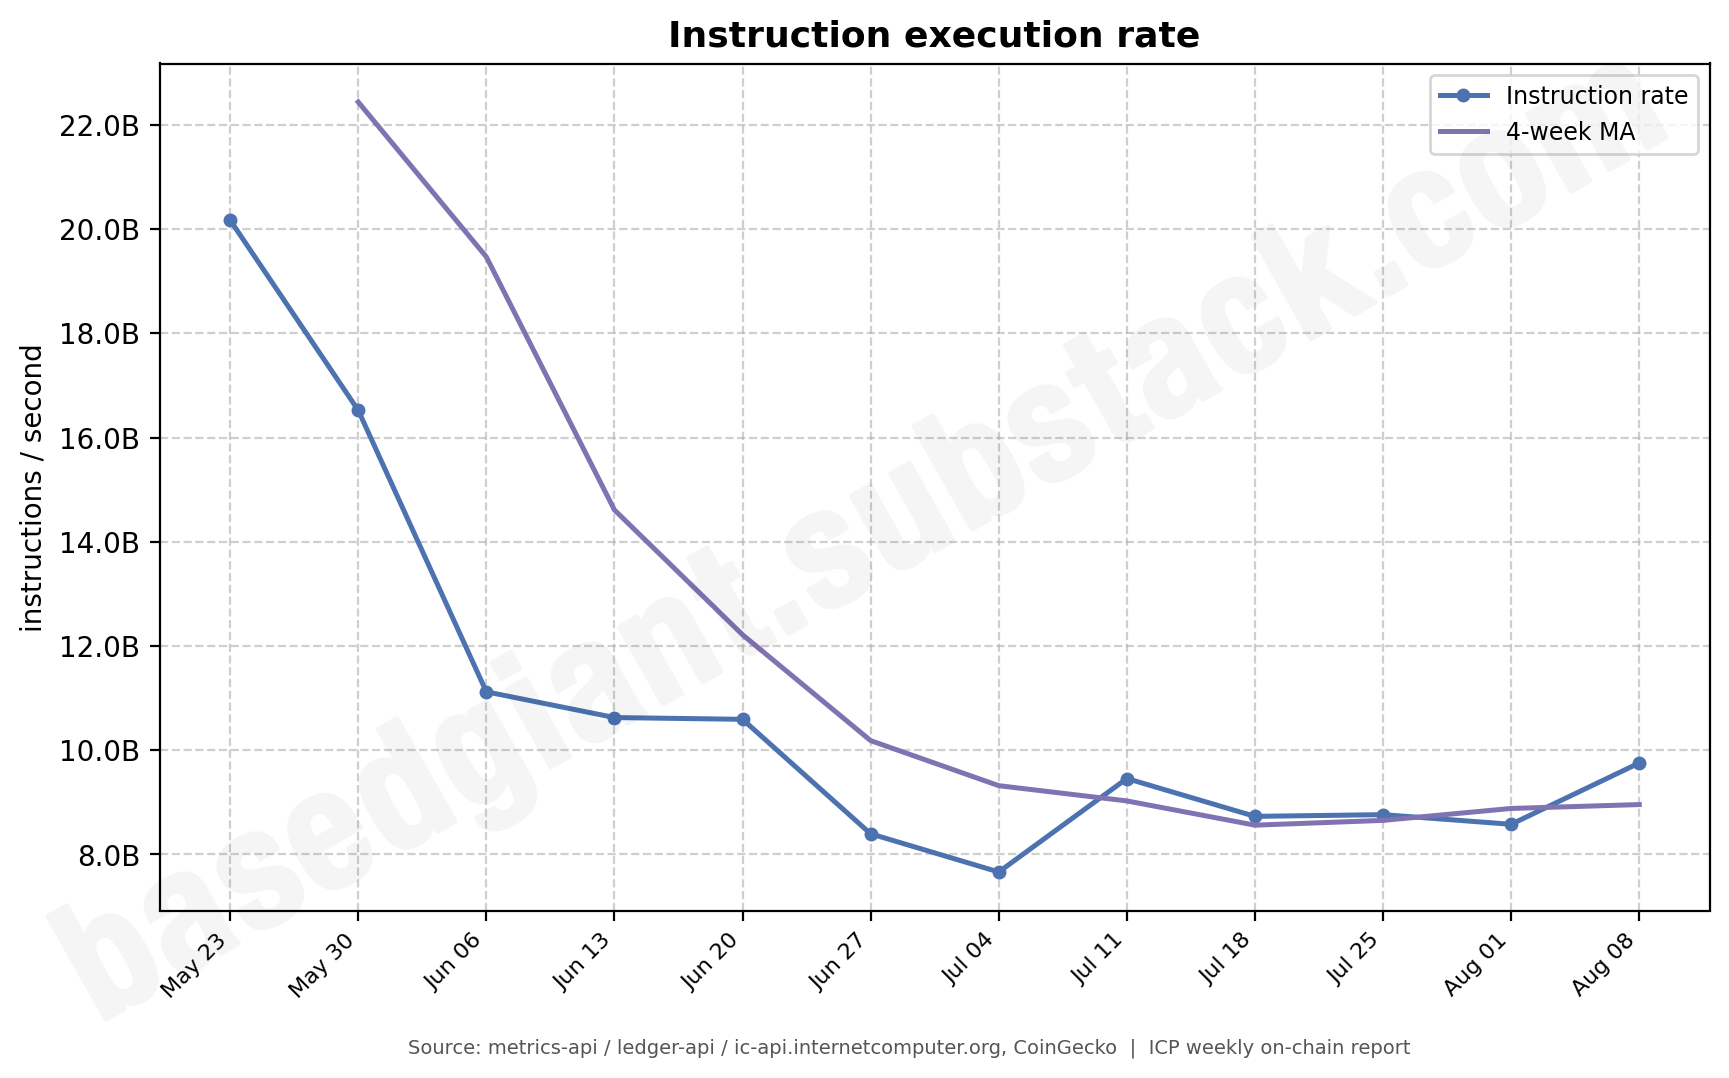
The most interesting movement this week was in instruction execution, also known as compute demand. The rate rose 14% to 9.8 billion instructions per second and crossed above its 4-week average.
Context matters here. In late May this metric was running at 20 billion per second. It has halved over 12 weeks, bottoming around 7.6 billion in early July. This week’s jump is a bounce off that floor, not a return to prior levels.
What makes it worth watching is how far it has pulled apart from everything else. Canister count and identity users both rose steadily through the same period, while compute per canister fell hard. The network keeps adding canisters and accounts while running far fewer instructions inside them.
Supply: 71,000 Minted, 12,000 Burned
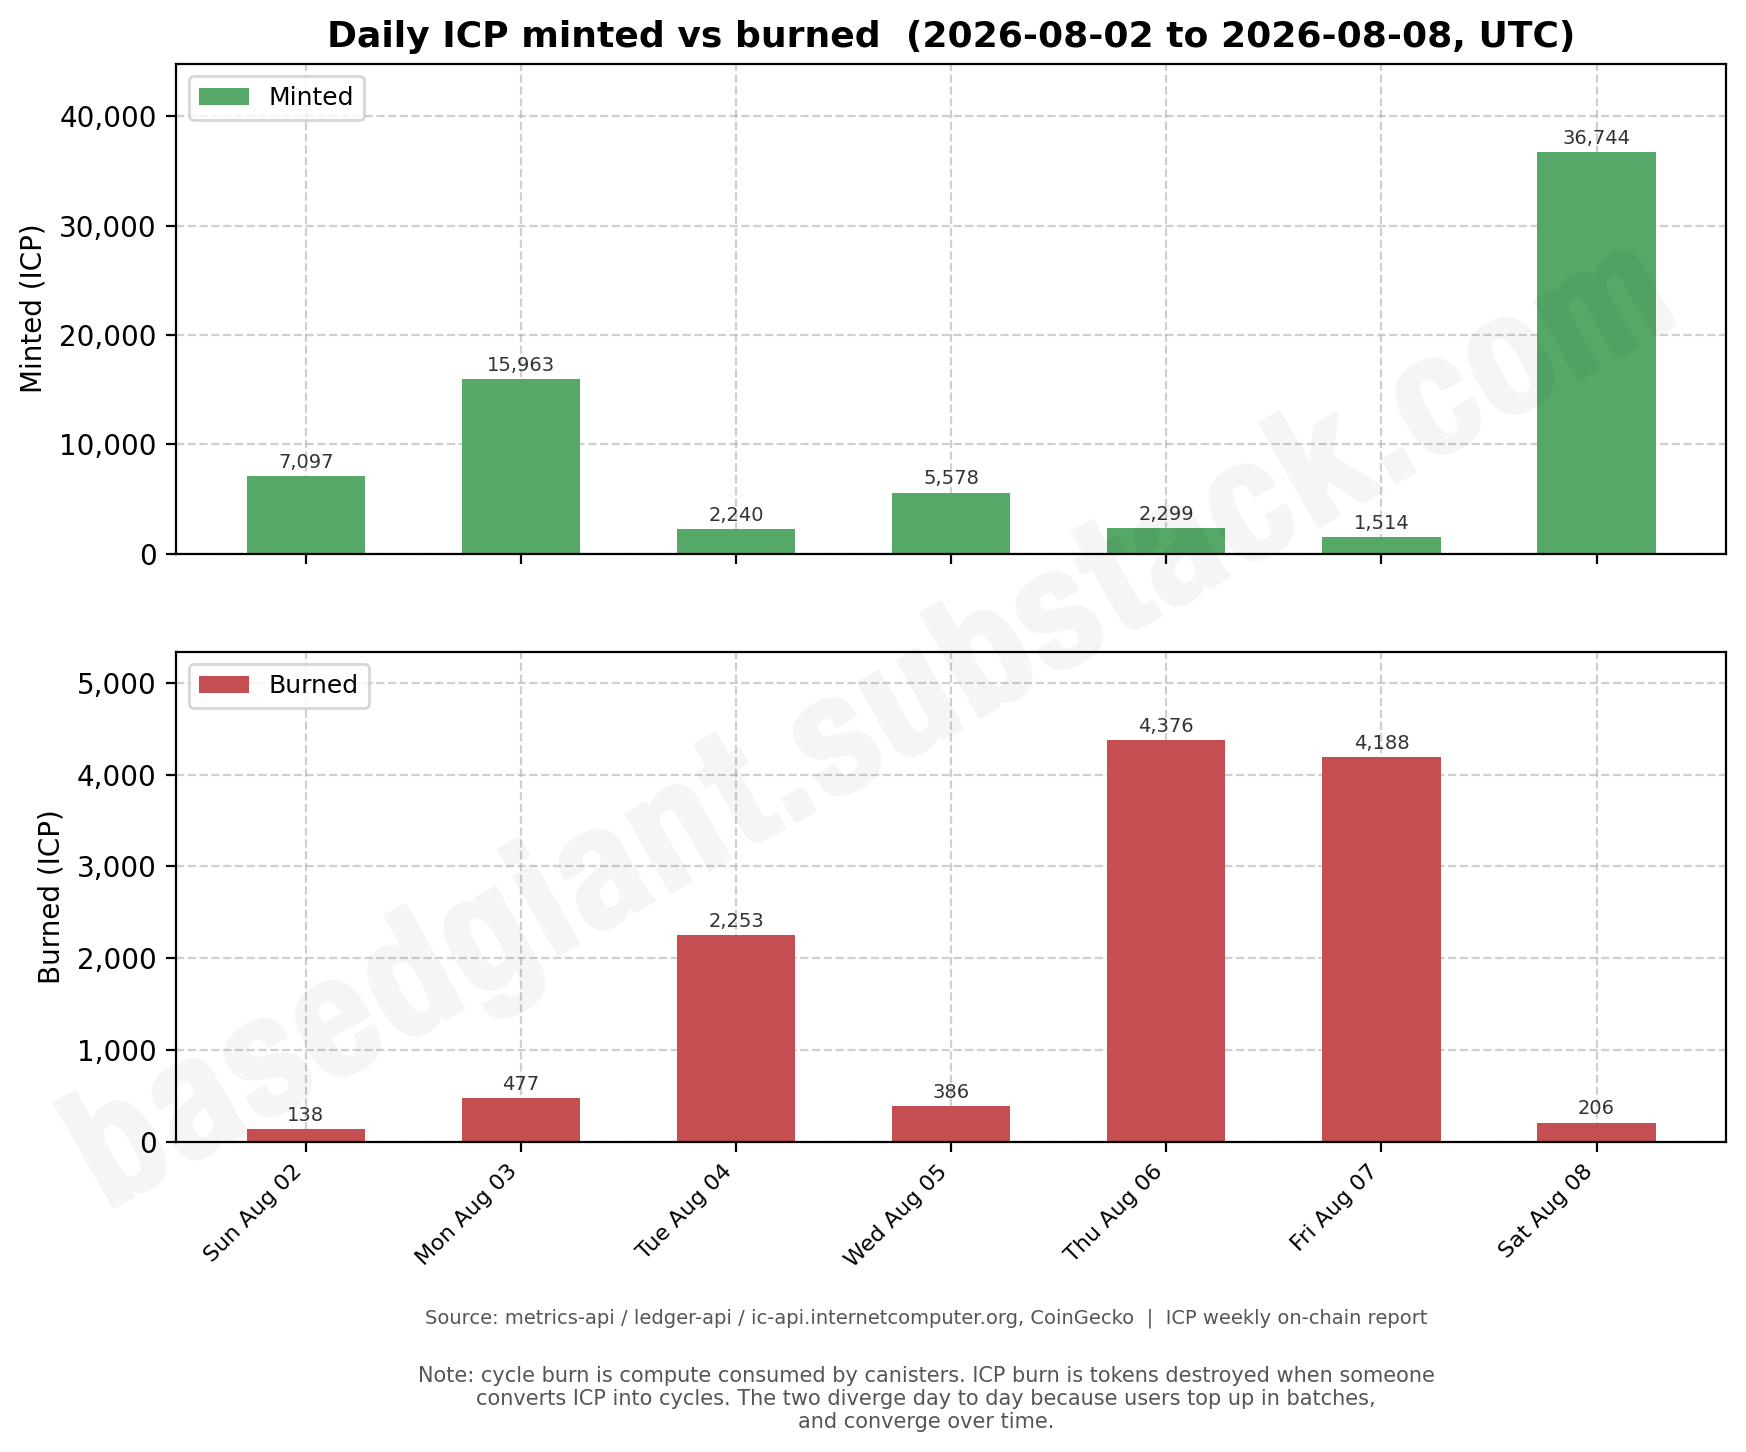
Minting ran about six times ahead of burning this week. Supply rose about 59,000 ICP, to 555.3 million.
The burn side improved sharply in relative terms. 12,025 ICP burned is up 63% on the week and has more than doubled over four weeks, lifting burn to 17% of minting from 9% the week before. Minting fell 10%.
The daily pattern is where this gets interesting, and it illustrates why the two burn metrics diverge. Thursday and Friday saw about 4,400 and 4,200 ICP burned. Saturday saw 206. Compute consumption barely moved across those three days, holding between roughly 3,200 and 3,800 XDR. Nobody converted much ICP on Saturday, but the network ran regardless.
The mint side has an outlier. 36,744 ICP was minted on Saturday, the largest single day of the week and more than half its total. Monthly node provider payouts land between the 13th and 16th, so this was not that. I do not know what it was. It is flagged and I will watch whether it recurs.
Inflation: 3.4% Measured, Why It Is Not the Whitepaper Number
ICP’s supply grew 3.4% over the past year. That is the real number, measured. It is not the number in the Mission 70 whitepaper, and it’s worth telling you why it differs.
The measurement first. Total supply went from 536.3 million ICP a year ago to 555.3 million now, a net increase of about 19 million ICP. That is measured straight from the ledger. Nothing is scaled up or estimated.
Shorter windows read lower: 2.4% over 13 weeks, 2.2% over four weeks. Both are shorter periods stretched out to a full-year figure, and both sit below the annual rate. Recent weeks have minted less than the past year averaged.
This figure cannot be compared to Mission 70’s targets, and I want to be direct about why. The whitepaper’s numbers are 9.72% for January 2026, 5.42% for January 2027 and 2.92% as the target. But the paper states plainly that these “refer to gross reward issuance under full maturity disbursement; realized inflation is lower in practice.” In plain terms: their figure assumes every reward ever earned gets converted into ICP. In reality most of it sits unconverted as maturity. Voting rewards are quoted “including undisbursed and disbursed maturity.”
That is DFINITY’s own forecast, calculated from how rewards are meant to work across every neuron. There is no way to rebuild that number from on-chain data. Setting 3.4% against 5.42% and concluding ICP is running ahead of schedule would be misleading, and it is a mistake I have seen made repeatedly.
The maturity pool is part of the explanation. Maturity is what voting rewards accumulate as before anyone converts them into actual ICP. The pool stands at 95.5 million ICP, up about 150,000 this week: rewards earned but not yet minted. That is roughly 17% of total supply sitting as a claim outside the ledger.
The valid Mission 70 scoreboard is the burn rate against 0.77 XDR/s, because that target is measured the same way in both places. It is 19x short.
Staking: Flat, Slow Drift Toward the Exit
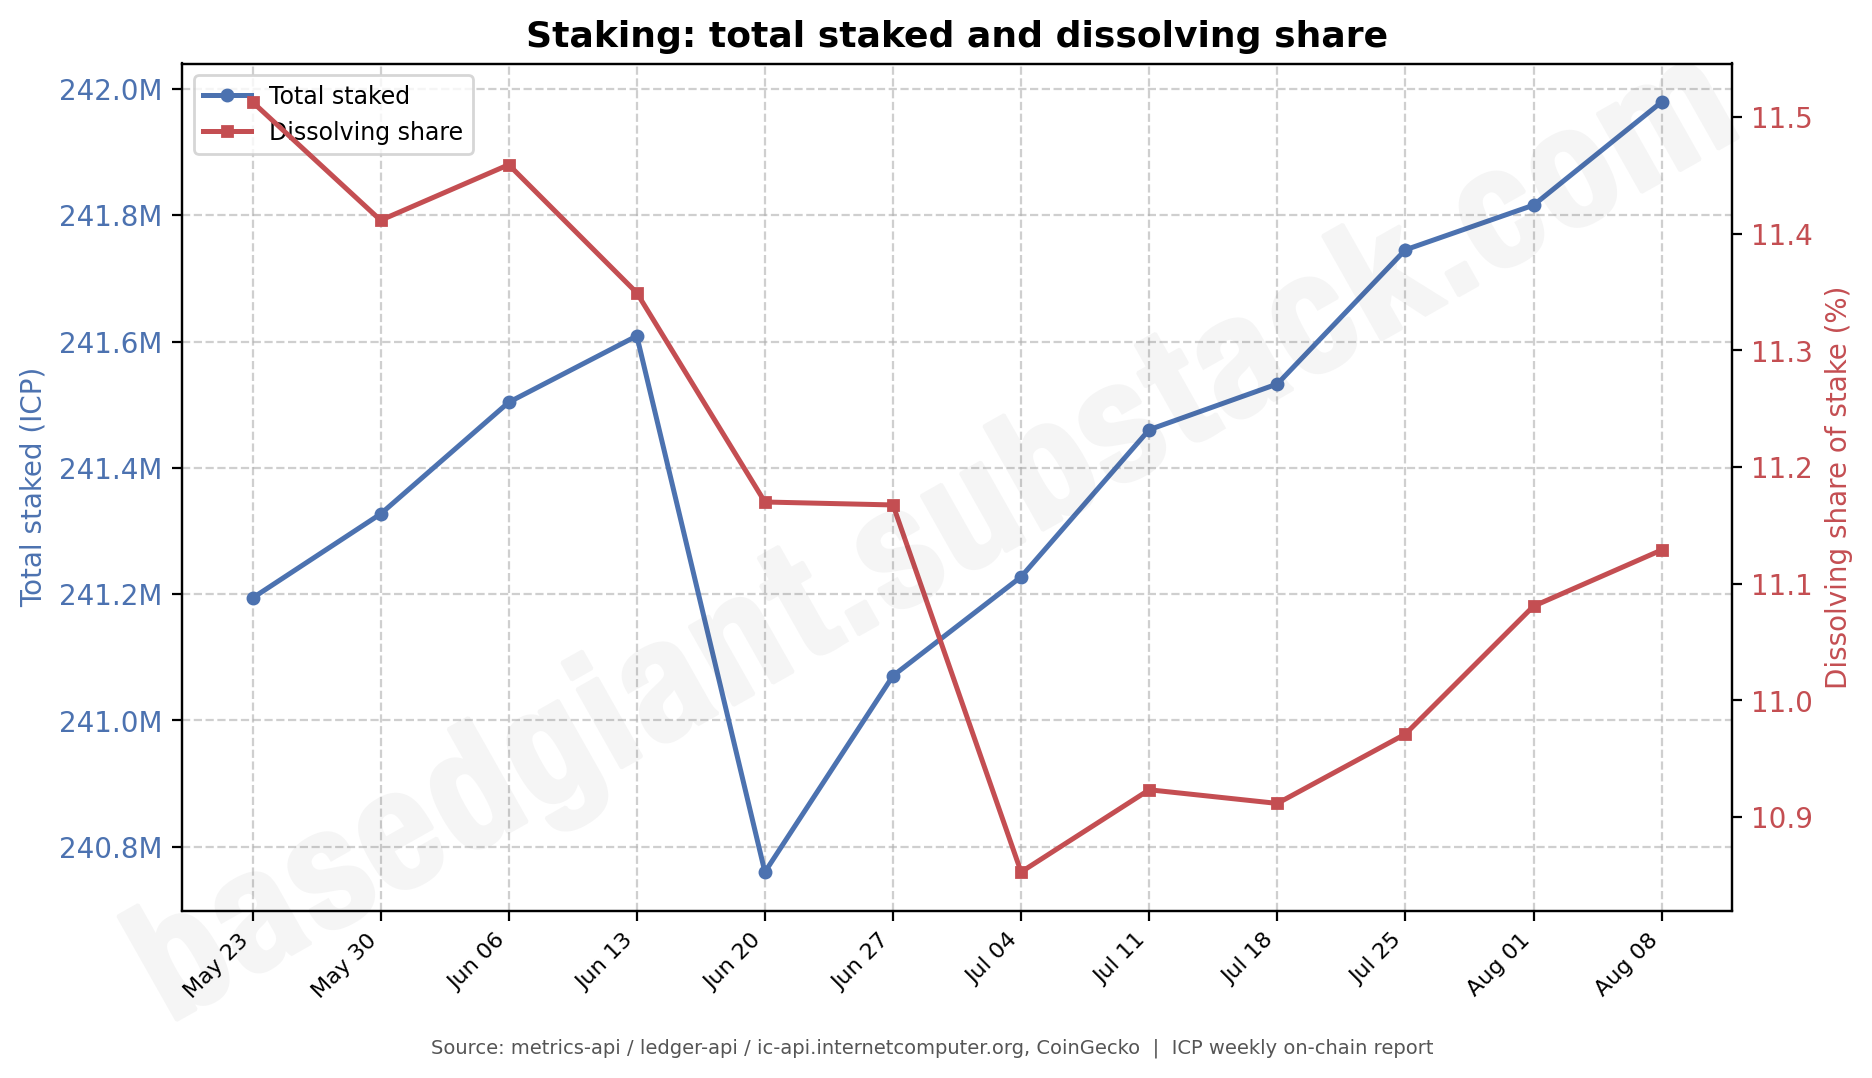
Total staked rose slightly, to 242 million ICP. Nothing dramatic.
The mix shifted slightly too. Dissolving stake rose 0.5% to 26.9 million ICP, while non-dissolving was flat. The dissolving share now sits at 11.1%, up slightly over four weeks.
That is a small drift and one week does not make a trend, but it is the fourth consecutive week the dissolving share has risen. Worth tracking rather than concluding anything too soon.
Network Usage: Growing, Slowly
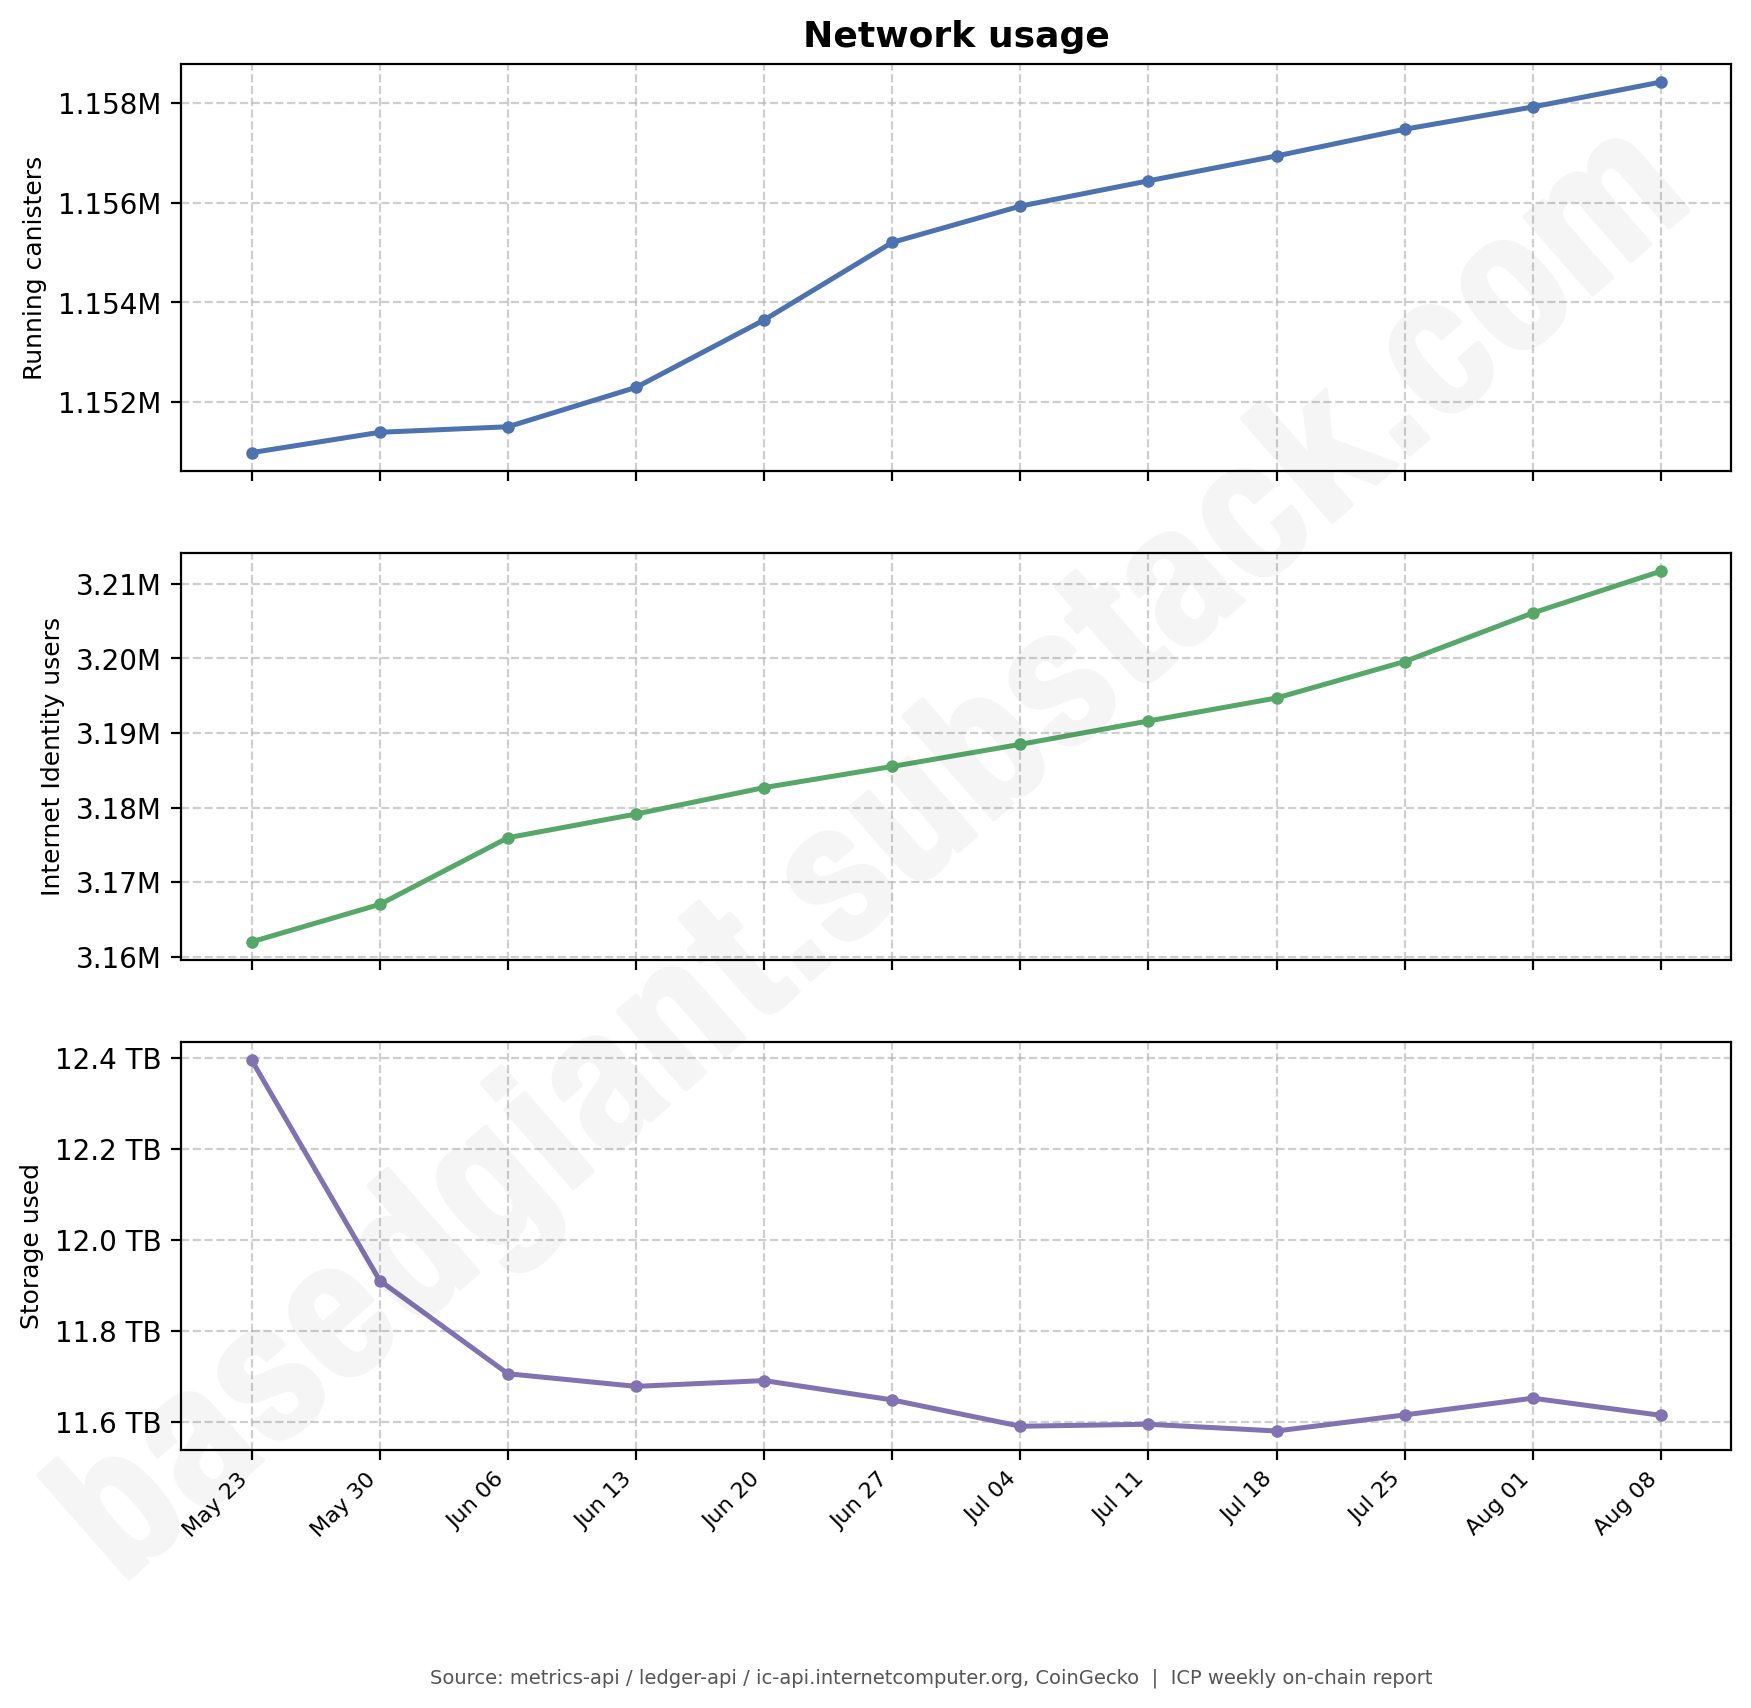
Canisters, identities and storage all moved by fractions of a percent.
Running canisters rose 500 to 1.16 million. Internet Identity users added 5,600 to 3.21 million. Storage fell slightly to 11.6 TB, and is essentially flat over four weeks.
The picture across 12 weeks is steady growth in canisters and identities, and storage sitting below where it was in May. Combined with the instruction rate collapse, the network is adding canisters faster than it is adding work for them to do.
Market: A Quiet Week That Ended Loudly
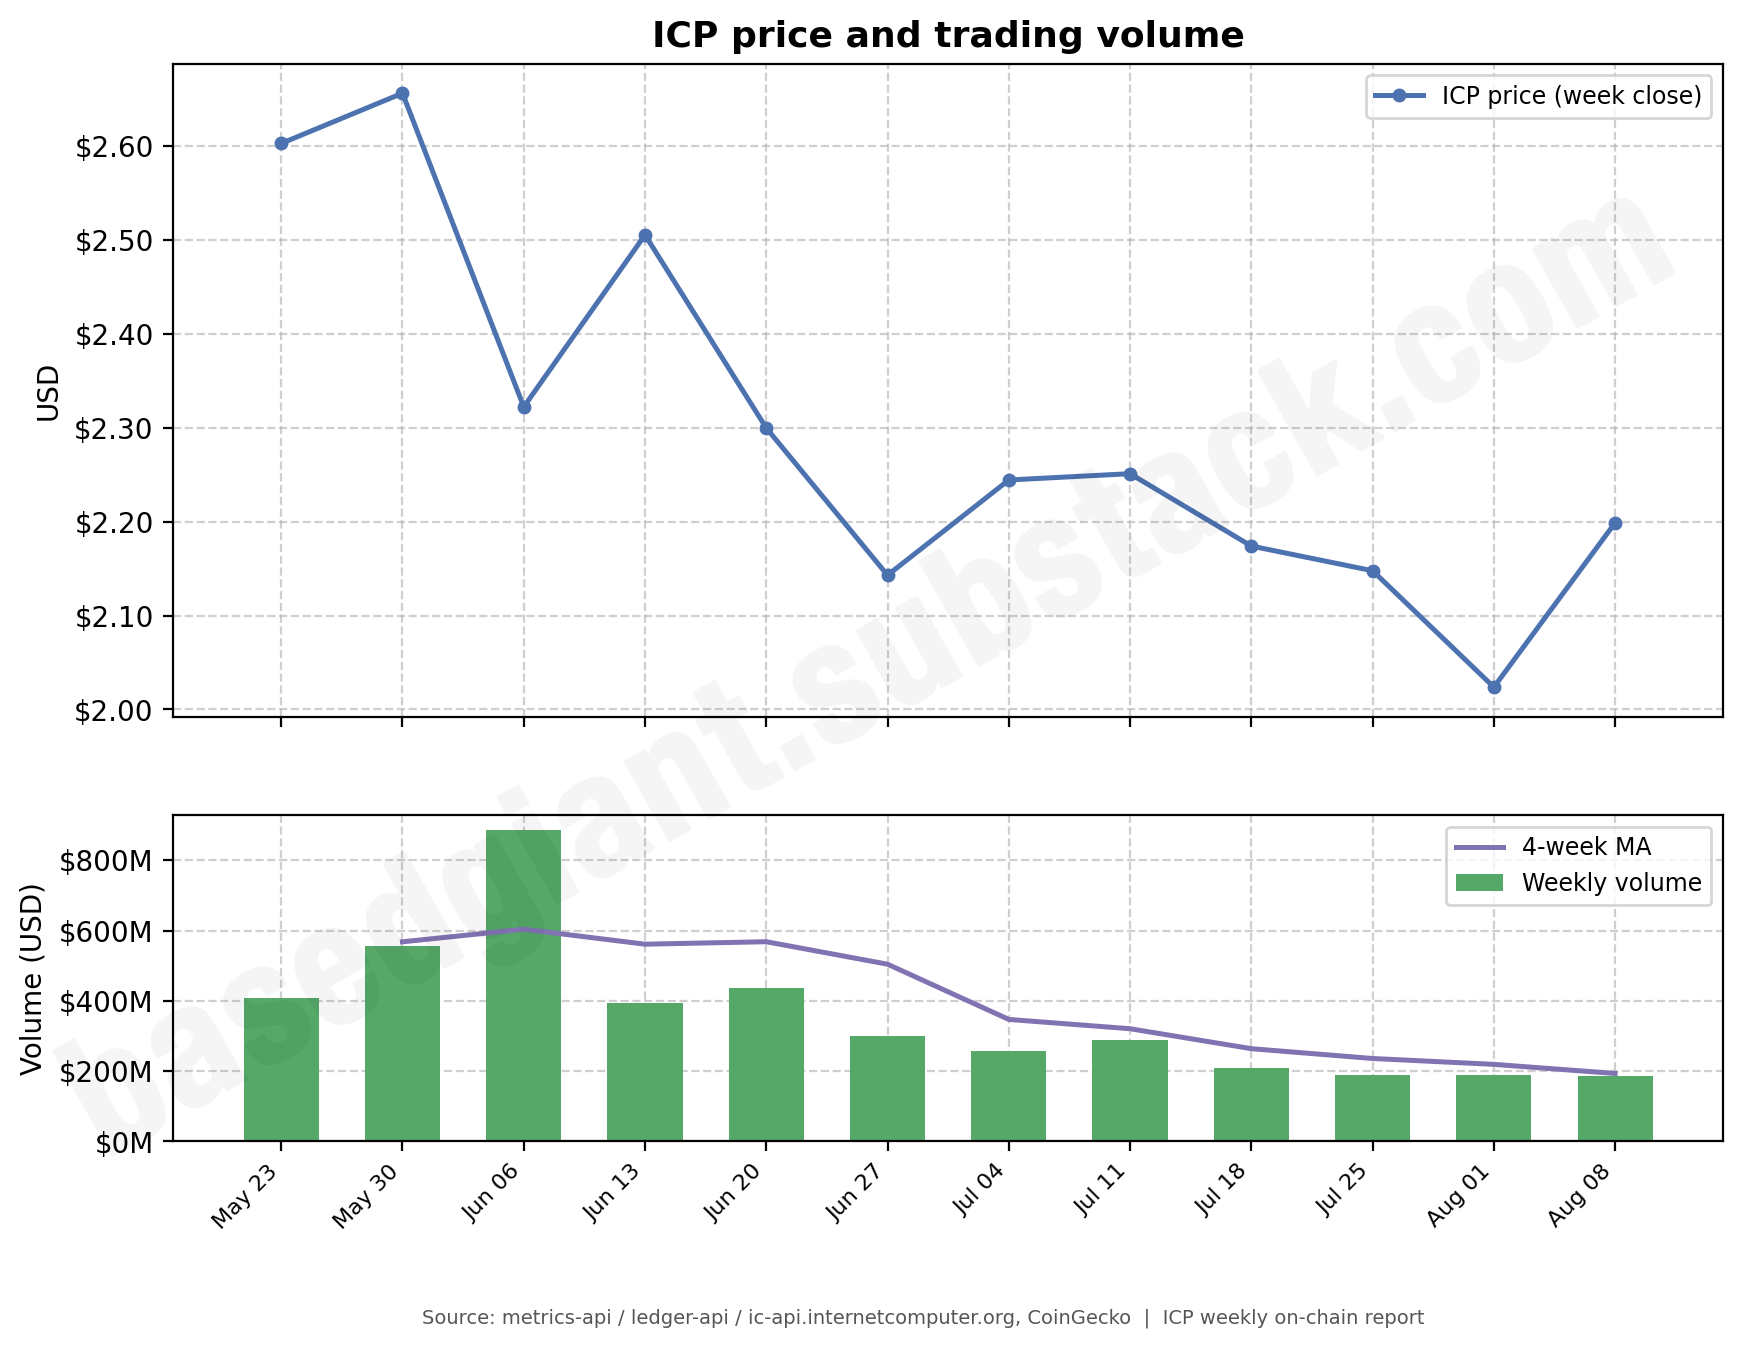
ICP closed the 7 day interval we measure at $2.20, up 9% week on week but still down 2% over four weeks.
Weekly trading volume was $186M, down 2% on the week and down 36% over four weeks. The 12-week trend is a steep decline from roughly $880M in early June.
The last day breaks the pattern though. Saturday saw price rise 5% on volume of $41M against $25M the day before, a 62% jump. Whether that carries into next week is next week’s question, but the yesterday ended on considerably more activity than the rest of the week ran on.
On-chain transfer volume tells a different story from exchange volume: 8.9M ICP moved, down 29% on the week, while the transfer count rose 14% to about 77,000. More transactions, smaller sizes. Main driver was exchange activity, perhaps derivatives.
The ICP/XDR floor set by proposal 142681 remains binding. The 30-day average sits at 1.58 against the 2.0 floor, meaning node provider rewards continue to be minted at the floor rate rather than the market rate.
Governance
157 proposals adopted, which sounds like a lot until you see the breakdown. Almost all were routine operational traffic: replica version deployments and subnet management. Fewer than ten covered anything else.
Internet Identity backend and frontend canisters were both upgraded on 3 August.
Currently open: an Internet Identity backend upgrade and a Subnet Rental Canister upgrade to version 0.7.0, both decided 11 August.
What I Am Watching Next Week
The Saturday mint. Nearly 37,000 ICP appeared in one day, outside the payout window, with no explanation I can find. If it recurs next week it is a pattern worth naming. If it does not, it was a one-off worth understanding anyway. If you know what it was, tell me in the comments or on Telegram. I would rather be corrected than guess.
Whether the volume spike holds. The week ended on 62% more volume than the day before.
The dissolving share. It has risen four weeks running. Still small, and well inside its normal range, but four weeks in one direction is the point at which I start paying attention.
This report goes out every Sunday. This first edition is free so you can decide whether it's worth paying for. Starting next week it goes to paid subscribers, at $5 a month. You can also find me on Telegram.